


Truck Mounted Crane Boom Load Chart Reading Guide
Views: 0 Author: Site Editor Publish Time: 2026-09-08 Origin: Site


In the high-stakes field of material handling and heavy construction, safety is not merely a compliance checkbox. It is the foundational metric of a successful project. Miscalculating a lift does not just cause temporary project delays. It triggers catastrophic accidents, tears apart expensive machinery, and invites severe legal liabilities. The primary defense against these disastrous outcomes? The proper, rigorous interpretation of the load chart.
Staring down a complex matrix of grids, numerical data, and technical jargon can easily overwhelm even seasoned operators. This is especially true when the pressure of a ticking project clock is breathing down their necks. Without a standardized, disciplined approach to interpreting this data, the risk of structural failure or tipping increases exponentially.
This guide serves as a definitive, practical manual for mastering load charts on any truck-mounted crane. By absorbing these principles, you will understand how to accurately calculate net capacities, decode critical technical terminologies, and make safe, informed decisions before the load ever leaves the ground.
Key Takeaways
Always Calculate Net Capacity: The bold number listed on a chart is merely the Gross Capacity. Operators must meticulously deduct the weight of all rigging, hooks, and jibs to determine the true, safe lifting threshold.
Radius is King: The operating radius—defined as the horizontal stretch from the center of rotation to the load's center—dictates your lifting capabilities more drastically than any other factor.
Respect the Bold Line: Most matrices feature a prominent bold line zig-zagging across the page. This critical boundary separates structural strength limits (where the metal could physically fail) from stability limits (where the entire truck is at risk of tipping).
Account for Boom Dynamics: Different equipment designs require different mathematical approaches. A straight telescopic extension behaves entirely differently under load than an articulating knuckle setup.
Never Guess or Estimate: If your exact boom length or operating radius is not explicitly listed on the page, standard safety protocols dictate rounding up to the next highest number to ensure a conservative safety margin.
What is a Truck Mounted Crane Boom Load Chart?
The Blueprint of Safe Lifting
A load chart is a legally required, manufacturer-provided technical document. It dictates the absolute maximum safe lifting capacity of a machine under highly specific, tested configurations. Think of it as the operational bible for site crews. The data within these pages is derived from rigorous engineering stress tests, calculating the exact moment at which the machine will either suffer catastrophic structural damage or lose its center of gravity.
Consequently, treating the chart as a set of loose guidelines rather than strict boundaries is a direct violation of both operational safety standards and the laws of physics.
Why It Matters for Your Equipment
These documents are not universal templates. A chart is engineered specifically for the exact make, model, and current physical setup of the crane sitting on your job site. For instance, a machine operating with its outriggers fully extended on solid ground will have a drastically different capability profile than one operating with outriggers at a 50% extension.
Whether you are utilizing a standard utility setup or a highly specialized Crane boom for engineering lifting equipment, the specific chart establishes your absolute operational boundaries. Swapping charts between similar models or ignoring configuration details invalidates all safety margins.
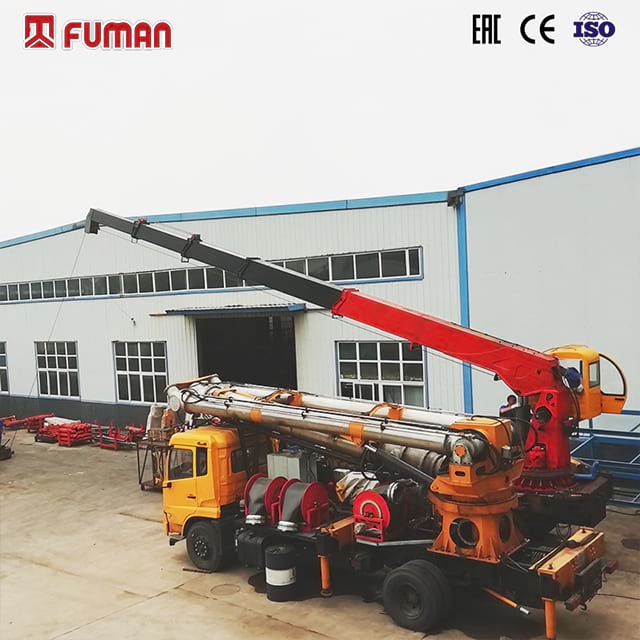
Essential Terminology for Crane Boom Operations
Fluency in the specific language of lifting operations is non-negotiable. Misinterpreting a single term on a windy, chaotic job site can lead to inaccurate calculations and fatal errors. Below is a breakdown of the most critical concepts operators must internalize before touching the controls.
Operating Radius: This is the horizontal distance measured from the crane’s center of rotation (the slew bearing) to the center of gravity of the freely suspended load. As the radius increases—either by lowering the angle or extending the reach—the lifting capacity decreases exponentially due to the amplified leverage against the truck chassis.
Boom Length: The total linear measurement from the base pivot pin to the center of the sheaves at the boom tip. While longer extensions provide necessary vertical reach, they inherently reduce overall lifting muscle at lower angles.
Boom Angle: The angle measured in degrees relative to the horizontal ground level. A lower angle stretches the load further away from the machine's center of gravity, significantly stripping away safe lifting limits.
Gross Capacity: The theoretical maximum weight the machine can lift as stated by the manufacturer, assuming a completely bare boom tip. This is a baseline structural metric, not a practical lifting target.
Net Capacity: The actual, true weight of the object the machine can safely hoist after all necessary deductions (rigging, hooks, cables) have been subtracted from the gross figure.
How to Read a Truck Mounted Crane Boom Load Chart
Navigating the numerical grid requires a logical, sequential process. Skipping a step to save time frequently compromises the integrity of the entire operation. Let's break down the exact workflow.
Step 1: Verifying the Chart Matches the Crane
Before your eyes even scan the numbers, you must verify that the document in your hand matches the specific serial number and model on the job site. Next, confirm the configuration page. Are the outriggers fully deployed and pinned? Are you lifting over the rear quadrant or swinging over the side? The selected page must reflect the exact physical state of the machinery sitting in the mud.
Step 2: Determining the Boom Length
Locate the specific column or row on the grid that indicates the current extended length of your equipment. For complex maneuvers, especially when operating a Telescopic crane boom for heavy engineering lifting, you must know exactly how many sections are deployed. If your exact measurement falls between two listed numbers, standard operating procedure dictates using the longer length to calculate a safer, more conservative limit.
Step 3: Ascertaining the Operating Radius
Find the exact operating radius required for the planned maneuver on the chart's axis. The golden rule of heavy lifting applies strictly here: if your exact radius is missing from the grid, you must always round up to the next highest radius provided. For example, if your tape measure reads 32 feet and the chart only displays 30 feet and 35 feet, you must calculate based on the 35-foot column. This ensures you never overestimate the machine's capabilities.
Step 4: Finding the Intersecting Gross Capacity
Trace the row representing your operating radius and the column for your boom length until they intersect. The number resting at this intersection is your Gross Capacity. Remember, this figure represents the absolute maximum stress the structure can support in that exact geometric position, assuming nothing is attached to the tip.
The Most Critical Calculation: Gross vs. Net Capacity
The single biggest mistake novice operators make is confusing gross capacity with net capacity. Manufacturers calculate the gross number in a vacuum, assuming a bare tip. If you attempt to lift a concrete barrier that weighs exactly the Gross Capacity, you will overload the machine the moment you attach the rigging.
The Deductions You Must Make
To discover your actual safe lifting weight—the Net Capacity—you must systematically deduct the weight of everything hanging from the tip. Standard deductions routinely include the main hook block, the headache ball, all rigging hardware (slings, shackles, heavy spreader bars), any stowed or erected jibs, and occasionally the weight of the hoist rope itself during deep-shaft lifts.
Capacity Type | Definition | Practical Application |
|---|---|---|
Gross Capacity | The theoretical max limit listed on the chart (assumes a bare boom tip). | Used strictly as a starting baseline for calculations. Never use this as your final lifting weight. |
Deductions | The combined weight of the hook block, rigging, shackles, and stowed jibs. | Must be manually calculated and subtracted from the Gross Capacity before every lift. |
Net Capacity | Gross Capacity minus Total Deductions. | The actual maximum weight of the payload (e.g., the steel beam or generator) you can safely lift. |
Practical Calculation Scenario
Consider a scenario where the matrix dictates a Gross Capacity of 15,000 lbs based on your current radius and length. You must now account for the attachments:
Main Hook Block: 600 lbs
Rigging (Chains and Shackles): 250 lbs
Stowed Jib: 450 lbs
Total Deductions: 1,300 lbs
Net Capacity Calculation: 15,000 lbs (Gross) - 1,300 lbs (Deductions) = 13,700 lbs (Net Capacity).
If the industrial generator you intend to hoist weighs 14,000 lbs, the operation is strictly unsafe and must be halted immediately, even though 14,000 is technically less than the 15,000 lbs Gross Capacity.
Structural Competence vs. Tipping Stability (The Bold Line)
When reviewing a comprehensive capacity matrix, operators frequently notice a thick, bold black line winding its way across the numbers. This is not a printing error or a formatting choice. It is a vital safety demarcation separating two entirely distinct types of mechanical failure.
Above the Line (Structural Limits)
Capacities listed above this bold line are restricted by the physical, structural strength of the steel and hydraulics. If an operator pushes past the limits in this upper zone, the truck likely will not tip over. Instead, the overwhelming weight will cause the boom to snap, the hydraulic cylinders to blow their seals, or the internal winch cables to shear apart violently.
Below the Line (Stability Limits)
Conversely, capacities listed below the bold line are governed by stability and leverage. Exceeding the thresholds in this lower zone means the load's leverage will overcome the counterweight of the chassis. In this scenario, the structural integrity of the steel might hold perfectly fine, but the entire truck will tip over, pulling the load and the cab into the ground.
Industry Perspectives: The Digital Shift vs. Manual Mastery
A prominent trend in the modern heavy equipment industry is the rapid integration of digitized Load Moment Indicators (LMIs) and advanced telematics. Recent industry data shows a massive surge in the adoption of AI-assisted LMIs across heavy construction sites. Modern cabs are outfitted with screens that calculate radius, angle, and net capacity in real-time, flashing warning lights before an overload occurs.
However, regulatory bodies and seasoned site managers are pushing back against "screen complacency." When sensors fall out of calibration, when a screen glitches due to extreme weather, or when pre-lift planning is required in the site trailer, digital systems cannot replace human knowledge. The industry consensus remains clear: mastery of the manual, paper load chart is not an outdated skill. It is a mandatory, legally binding competency that serves as the ultimate failsafe when technology inevitably falters.
How Different Boom Types Affect the Load Chart
Equipment design fundamentally alters lifting dynamics. Operators cannot apply the logic of one machine type to another without inviting disaster. The physics change entirely based on how the arm extends.
Telescopic Extension Dynamics
Straight telescopic designs operate by sliding internal sections outward. Pushing these sections outward fundamentally shifts the center of gravity. For example, a standard 4-section U-shaped boom requires these sections to be extended in a highly specific sequence—such as proportional extension—to maintain the validity of the printed capacities. Failing to follow this sequence creates localized weak points that the chart simply does not account for.
Hydraulic Knuckle Boom Dynamics
In contrast, articulating setups function entirely differently. A Hydraulic crane boom for construction lifting equipment features multiple articulation knuckles. Because the arm can bend and fold over itself, the bending moments applied to the base change drastically depending on the angle of the secondary arm relative to the primary arm. Take a 30-ton class knuckle boom: if the secondary arm is angled at 45 degrees, the stress on the slew bearing is vastly different than a flat horizontal reach. Operators running knuckle setups must rely on highly specialized articulation charts that map out the geometry of multiple pivot points simultaneously.
Fatal Mistakes to Avoid When Reading a Load Chart
Even with rigorous training, human error remains a persistent threat on busy job sites. Actively avoiding these common pitfalls is essential for maintaining a zero-accident environment.
Guessing the Load Weight: Never estimate the weight of a load based on a quick visual inspection. Always demand a verified bill of lading, hook up an inline dynamometer, or meticulously calculate the weight based on material density and volume before consulting the matrix.
Ignoring Wind Speeds: Printed capacities are engineered based on ideal, perfectly calm weather conditions. High winds act as a massive sail, adding severe dynamic side-loading stress to the extended metal. Operations must be aggressively scaled back or completely halted when wind speeds approach manufacturer limits.
Failing to Fully Extend Outriggers: Standard matrices assume 100% outrigger extension on firm, level ground. If tight site constraints prevent full deployment, you cannot use the standard page. You must locate the specific "mid-span" or "retracted" chart, which will display drastically reduced lifting thresholds.
Reading the Wrong Quadrant Chart: Capacity fluctuates based on where the arm is pointing. A machine rated to hoist 10 tons over the rear chassis might only be rated for 4 tons when swinging over the side. Using an "over the rear" chart for an "over the side" maneuver guarantees a tip-over.
Choosing the Right Crane Boom for Your Next Project
Understanding how to interpret these documents is not just an operator's duty; it is a vital procurement skill. Site managers and equipment buyers must deeply analyze load charts before signing rental agreements or purchasing new machinery.
Do not just look at the maximum theoretical tonnage. Instead, apply the 75% Rule of Thumb. If your daily site operations require hoisting materials that consistently sit at 90% to 95% of a 10-ton machine's maximum net capacity, that specific machine is inadequate. Operating constantly at the ragged edge of a chart accelerates metal fatigue, skyrockets hydraulic maintenance costs, and leaves zero margin for error regarding unexpected wind gusts.
In such scenarios, analyzing the data will clearly dictate the necessity of upgrading to a heavier class model. Evaluating heavy equipment strictly through the lens of its capacity matrix ensures you invest in reliable solutions that match your engineering realities without ever compromising on safety.
Conclusion
Load charts represent the strict, unyielding limits of physics and mechanical engineering. They are not suggestions to be stretched; they are boundaries to be respected. By consistently calculating net capacity, rigorously measuring the operating radius, and understanding the nuances of your specific boom type, you protect your crew, your equipment, and your project's bottom line.
Prioritize continuous training, ensure your operators are fluent in manual chart interpretation, and invest in robust machinery backed by clear, comprehensive lifting data. If you are configuring your fleet for upcoming heavy construction tasks, ensure you select equipment that offers transparent, robust capacity charts and reliable structural integrity. For tailored lifting solutions and high-performance machinery, explore the specialized configurations available at FUMAN to match your exact project demands.
FAQ
Do I have to deduct the weight of the truck mounted crane boom itself?
No, you do not. The manufacturer's engineers have already accounted for the dead weight of the boom structure when calculating the gross capacity numbers printed on the chart. You are only responsible for deducting the weight of external attachments, hooks, and rigging.
What do I do if my operating radius falls exactly between two numbers on the chart?
You must always default to the next longest radius listed on the page. Because lifting capacity decreases as the radius increases, rounding up to the longer distance forces you to use a lower, much safer lifting limit, ensuring you never inadvertently overload the machine.
Does lifting over the front of the truck change the load chart?
Absolutely. Most truck-mounted setups possess wildly different stability profiles depending on the quadrant of operation—over the rear, over the side, or over the front cab. Lifting over the front often offers the lowest capacity due to the lack of engine counterweight and outrigger placement. Always verify you are reading the correct chart for your specific rotation zone.
How does wind speed affect the load chart capacities?
Load charts are calculated based on static loads in ideal, windless conditions. High wind speeds introduce dynamic side-loading, which pushes the boom laterally and drastically reduces its structural stability. If wind speeds exceed the manufacturer's maximum allowable limit (often around 20 mph, depending on the model), the lift must be suspended entirely, regardless of what the load chart says.
What is the difference between a static load and a dynamic load?
A static load is a weight that is lifted smoothly and held perfectly still. A dynamic load occurs when the weight shifts, swings, or is hoisted/stopped abruptly. Dynamic loading multiplies the stress on the boom and rigging. Load charts only account for static loads, which is why operators must handle controls smoothly to avoid creating dynamic forces that could exceed the chart's limits.


